Başak Uğur ÖnemProduct DesignerNiceCase file 05 · 2024
Case file 05 · 2024

Forty pages.Fifteen seconds.

Dalos Network · 2024 · AI · SaaS · Web

An AI tool that grades crypto whitepapers and helps teams improve them. The design job was turning long model output into a score people can scan, trust and act on.

Project
Whitepaper IQ
Client
Dalos Network
Role
Product designer
Year
2024
00.1 Opening and TL;DR

Investors don't need to be engineers to back a project. They do need to understand what they're backing.

Most people can't judge from a whitepaper whether a project is feasible or trustworthy, and few have the time to dig in. A clear grade lets a good project be understood for what it is.

I designed Whitepaper IQ around one principle: the score first, the reasons one click away.

Below: the morning before, the flows, three decisions and the report.

Analysis
10–15 seconds
Files
PDF up to 15 MB
Access
Free, no sign-in
Daily quota
5 uploads a day
01.1 Forty pages before lunch

One morning, one whitepaper, no verdict.

An investor has one morning to judge a new project. The whitepaper is the only source.

  1. Whitepaper_v3.pdf1 / 40

    11:20 AMA new project to evaluate.

  2. Whitepaper_v3.pdf3 / 40 Tokenomicsp. 27

    11:42 AMTokenomics is on page 27.

  3. AI chat Summarize this paper Sources: none

    11:51 AMThe AI summary is just more text.

  4. ? Heads · investTails · pass

    11:58 AMSo the decision comes down to gut feeling.

  5. End of file

    Scroll down to see the same paper scored.

1 / 5
Illustrative scenario · dummy data
whitepaper_review.logProject X · before Whitepaper IQ
  1. 01Download a 40-page PDF✕ no summary
  2. 02Read the tokenomics✕ buried on page 27
  3. 03Compare with other projects✕ no common yardstick
  4. 04Ask an AI chat✕ a wall of text, no sources
  5. 05Decide✕ on gut feeling
02.1 The flow

Six objects, one report.

Two gates sit in front of every score: the file check and the daily quota.

ObjectStatesRule
Whitepaperuploaded → analyzing (10–15 s) → scoredPDF only, up to 15 MB.
Scoretotal + 7 categoriesTotal first, categories under it.
Categorycollapsed → expanded (green flags, red flags)Every score opens to its reasons.
IQBot chatwelcome → question → answerSits beside the report, never replaces it.
Visitorguest → signed inSign-in is optional and adds a history.
Daily quota0 to 5 uploadsShown under the upload button.
Fig 01 · Information architecture Whitepaper IQ LandingUpload · 7 categories ReportSplit screen HistorySigned in only File checkGate · PDF, 15 MB Daily quotaGate · 5 a day Total + 7 categoriesEach opens to flags IQBot chatBeside the report
Whitepaper IQ
Landing
  • Upload Gate file check: PDF up to 15 MB
  • Gate daily quota: 5 uploads
  • Example questions
  • The 7 categories
  • Features
  • FAQ
Report
  • Total score
  • 7 categories, each opens to green and red flags
  • IQBot chat
History
  • Signed-in visitors only
ScreenGate or check
Notice that both gates sit on the landing page, before any report. Hover a table row to light its screens.
User flows
Fig 02 · A · Upload and analyze Visitor System NoNoRetryFile errorLimit reachedStop · try tomorrow Yes Yes UploadLanding Valid file? Under 5? Analyzing10–15 s · automatic ReportScore first
  1. Upload From the landing page
  2. PDF up to 15 MB? No: file error, pick another file · Yes: continue
  3. Under 5 uploads today? No: limit reached, come back tomorrow · Yes: continue
  4. Limit reached Stop · try tomorrow
  5. Analyzing System · 10–15 seconds
  6. Report Score first
DecisionSystemStop
Notice that both checks run before the wait, never after it.
Fig 06 · What one upload sets off
Upload whitepaperProject_X_v3.pdf · 4.2 MBAnalyze
  • Read the PDF✓
  • Score 7 categories✓
  • Find green and red flags✓
  • Total score✓
Report in 10–15 sIQBot ready to answer

Illustrative mock · dummy data
One upload runs four jobs. Before, each one was a person reading.
02.2 The research-to-design strategy map

Every decision traces back to evidence.

Research evidenceCore insightDesign decision
Investors weren't sure a project was ready to invest in. The research was slow, and most lacked the technical background to judge it.Building Web3 products
I1Investors need a verdict they can trust without a technical background.
D1The score first
Great projects missed investment because their whitepapers were weak, not because the projects were.Building Web3 products
I2A score only helps if it says why: investors can trust it, founders can fix it.
D2Reasons behind every score
Without a technical background, investors had nobody to ask about what a whitepaper actually claims.Building Web3 products
I3Questions come after the score, not instead of it.
D3IQBot beside the report
02.3 Key design decisions

Three decisions that shaped the report.

Decision 01 D1

What I decided

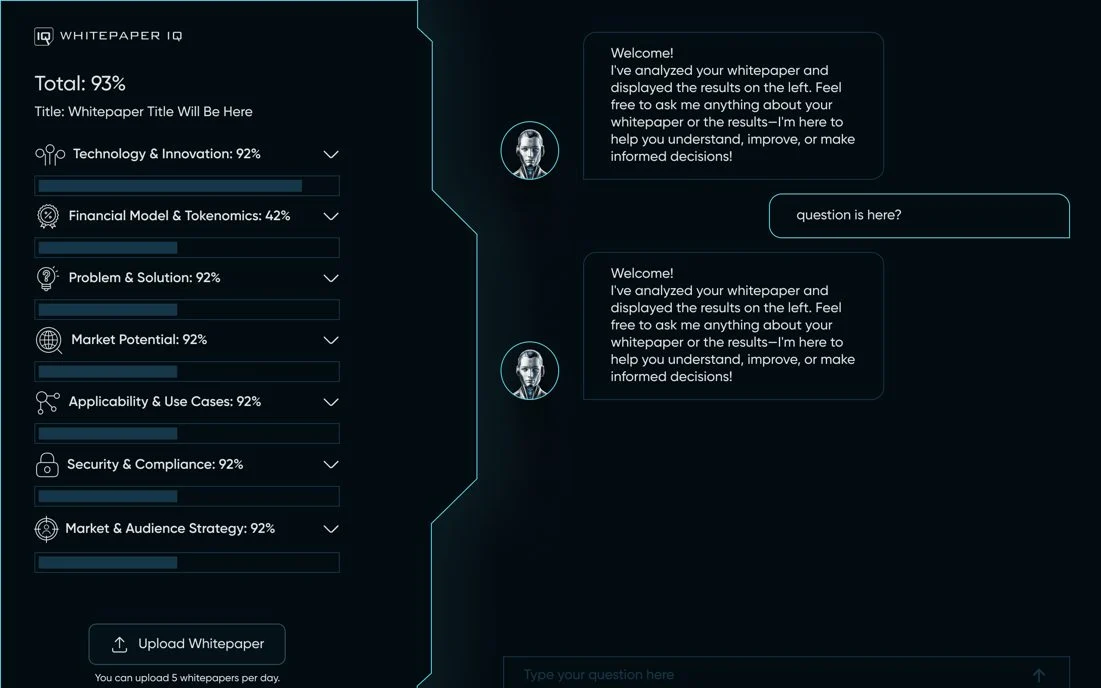
The report opens on one total score with the whitepaper title, then seven category rows, each a percentage with a progress bar.

The report screen: Total 93% and the whitepaper title on top, seven category rows with progress bars, IQBot on the right
The whole report · zooming into the score
Illustrative mock · dummy data
Decision 02 D2

What I decided

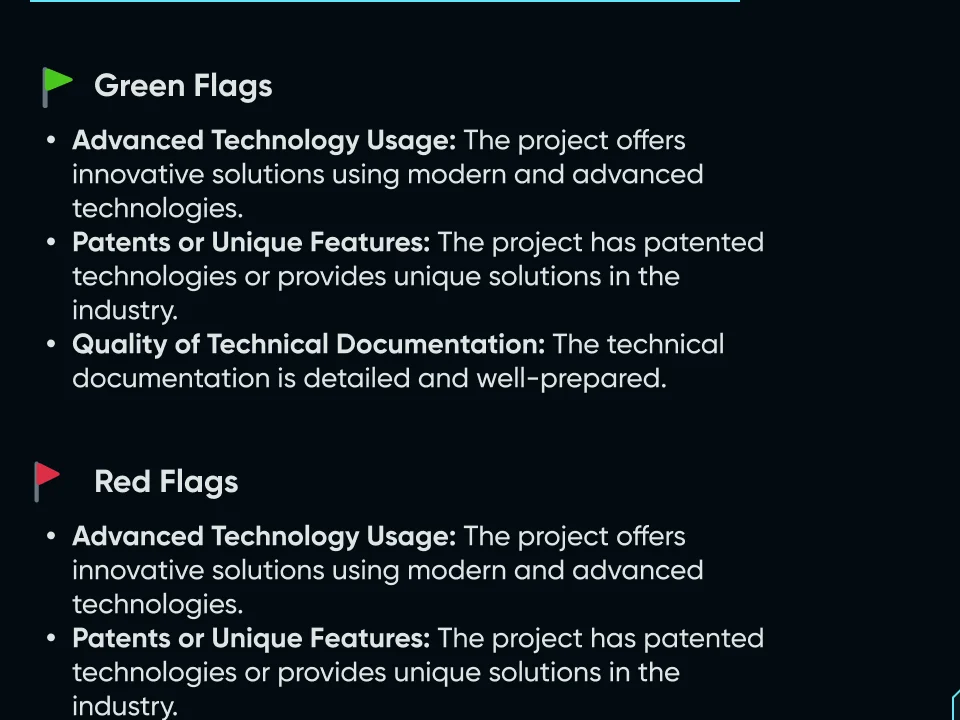
Each category opens to Green flags and Red flags, each a bold criterion with one line of explanation. The seven categories also appear on the landing page before upload, with the same icons, so the scoring isn't a black box.

An open category: Green flags and Red flags, each a bold criterion with one line of explanation
An open category · the green flags first
Illustrative mock · dummy data
Decision 03 D3

What I decided

A split screen with the report on the left and IQBot on the right. IQBot's first message points people to the results.

Split screen: the report on the left, IQBot on the right with its first message pointing to the results
The whole screen · zooming into IQBot
Illustrative mock · dummy data
Try it · decision 03
ScoreTotal 93%
Categories7 rows · lowest: tokenomics 84%
YouWhy is tokenomics the lowest?
IQBotVesting unclear · no supply cap
Report beside IQBot: the score stays in view while you ask. Illustrative mock · dummy data
CAPBASE Whitepaper IQ
Technology & Innovation · Financial Model & Tokenomics · Problem & Solution · Market Potential · Applicability & Use Cases · Security & Compliance · Market & Audience Strategy ·
03.1 The report

Every score shows its reasons.

Total: 93%

Title: Project X Whitepaper

  • Green flags

    • Clear token utility: The token pays fees, secures staking and votes.
    • Allocation table: Team, investor and community shares are listed.

    Red flags

    • Vesting unclear: The team unlock schedule isn't stated.
    • No supply cap: Total supply can grow with no stated limit.

Welcome! I've analyzed your whitepaper and put the results on the left. Ask me anything about them.

Why is tokenomics the lowest?

Tokenomics scored 84%, the lowest of the seven, for two reasons:

  • The team vesting schedule isn't stated
  • There is no cap on total supply

Fix both and this category moves first.

  • Score first
  • Reasons one click away
  • Green and red flags
  • Assistant beside, not instead
Illustrative mock · dummy data
Notice that opening a category or asking IQBot never moves the total. Click any category to try it.
15KWhitepapers graded
7Categories
15Seconds at most
5Uploads a day
Explore the landing page
The landing page at 1440px, scaled to fit · press Esc or move away to scroll this page againOpen the full page
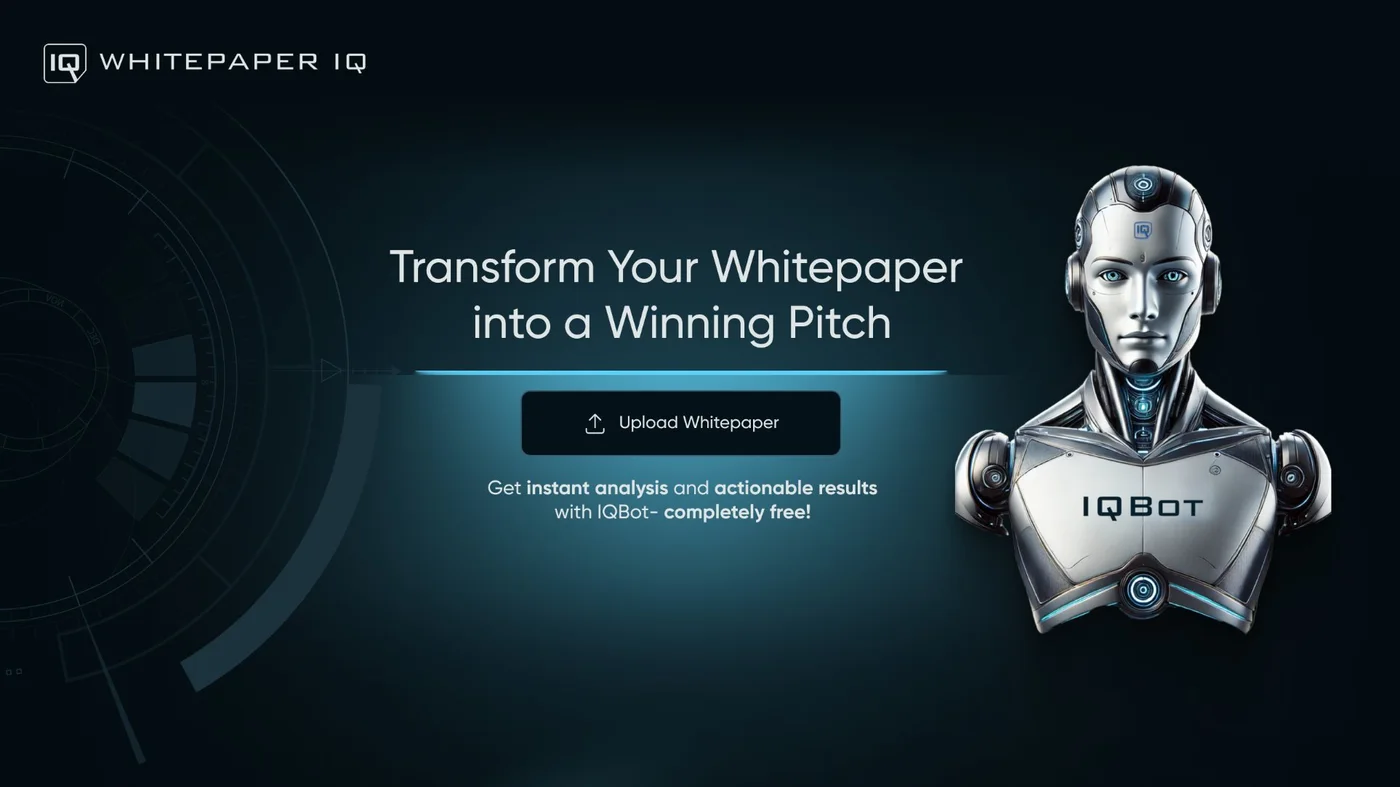
Whitepaper IQ landing page: Transform your whitepaper into a winning pitch, an Upload Whitepaper button, and IQBot beside it.

Open the landing page

Highlights
  1. 01One total score first
  2. 02Seven category scores underneath
  3. 03Every category opens to green and red flags
  4. 04IQBot beside the report, not instead of it
03.2 Outcome and what's next

15,000 whitepapers graded.

The model could always write more. The design work was choosing what to show first. A score earns trust only when its reasons are one click away, for founders and investors alike.

Next: a public project page built from the score.